March 23, 2024
Understanding the Global Climate Crisis Through 6 Key Figures
Introduction:
- The World Meteorological Organization (WMO) recently released its annual State of the Climate report, highlighting alarming trends in various indicators of the Earth’s health. This report serves as a critical tool in comprehending the severity of climate change and its impact on our planet. Let’s delve into six key figures from the report that shed light on the current state of our climate.
Greenhouse Gases (GHGs):
- GHGs such as carbon dioxide (CO2), methane (CH4), and nitrous oxide (N2O) have reached unprecedented levels in the atmosphere, contributing significantly to global warming.
- The concentration of these gases, as observed from 1984 to 2022, has surged to record highs, intensifying the greenhouse effect and accelerating climate change.
Surface Temperature:
- In 2023, the global average near-surface temperature soared to 1.45 degrees Celsius above pre-industrial levels, marking the highest ever recorded.
- This increase is primarily attributed to rising GHG concentrations, compounded by the effects of El Niño, which led to extreme heat events globally.
Ocean Heat Content (OHC):
- Oceans have absorbed approximately 90% of the excess heat trapped by GHGs since 1971, causing a steady rise in ocean temperatures.
- The OHC reached its peak in 2023, signifying the highest level of heat stored in the oceans in the past 65 years.
Marine Heat Waves (MHWs):
- Warmer temperatures have fueled an increase in the frequency and intensity of marine heatwaves (MHWs) globally.
- The coverage of MHWs in 2023 expanded to 32%, surpassing previous records and posing significant threats to marine ecosystems.
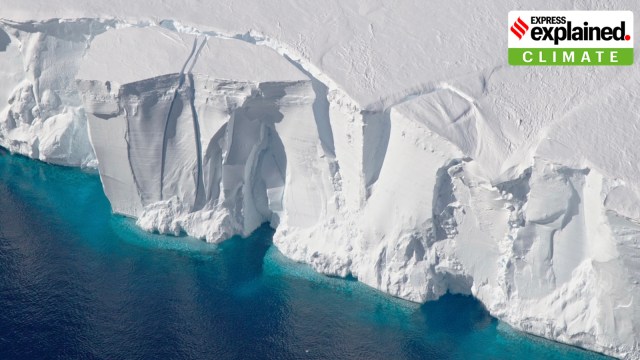
Antarctic Sea-Ice Extent:
- Antarctic sea-ice extent hit a new record low of 1.79 million km2 in February 2023, the lowest since satellite observations began in 1979.
- This decline persisted from June to early November, with the annual maximum in September dropping significantly below the long-term average.
Glacier Mass Balance:
- The hydrological year 2022-2023 witnessed the largest loss of ice on record for the global set of reference glaciers.
- Glaciers in North America and Europe were severely affected, with the annual mass balance plummeting to a new low of -1.2 meters water equivalent (m w.e.).
Conclusion:
- The WMO’s State of the Climate report provides compelling evidence of the intensifying climate crisis, as depicted by these six critical figures. From rising GHG levels to melting glaciers, each indicator underscores the urgent need for decisive action to mitigate the impacts of climate change and safeguard the health of our planet for future generations.
Llama 3:
April 24, 2024
Global Plastic Treaty:
April 24, 2024
THE WORLD TIGER DAY CELEBRATION
August 5, 2022
A new Sample data for Polity & Governance
July 27, 2022
Sample data for Polity & Governance
July 27, 2022