December 25, 2025
Four trends redefining the North Indian Ocean’s storm cycle
The cyclonic disturbances over the North Indian Ocean, which include the Arabian Sea, the Bay of Bengal, and the land area in between, have changed drastically over the last century.
Broadly, there are four major trends. First, the frequency of cyclonic disturbances has shifted significantly. Chart 1 plots annual disturbances (left axis) alongside a 10-year rolling average (right axis) from 1900 to 2025. While annual figures are often volatile, the 10-year rolling average smooths out this “noise”, making it easier to identify whether the long-term trend is actually rising or falling.
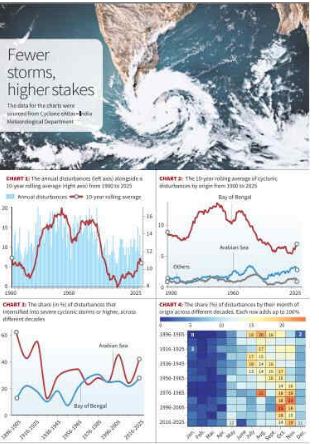
- The chart reveals a distinct inverted U-shaped trend in the past century. Between 1900 and 1920, the 10-year rolling average of cyclonic disturbances remained below 10. This figure surged to over 15 by the 1930s, initiating a period of relative stability that lasted through the 1970s. However, the 1980s and 1990s saw a sharp decline, culminating in a new low in the 2000s when the average dropped to eight. While activity rebounded in the 2010s and continues to climb in the 2020s, current levels remain significantly lower than the mid-century peaks.
- Second, the overall decline in disturbances in recent years is driven almost entirely by a sharp drop in activity within the Bay of Bengal. Chart 2 breaks down the 10-year rolling average of cyclonic disturbances by origin: the Bay of Bengal, the Arabian Sea, and inland/other areas. While the Bay remains the primary cradle for disturbances in the North Indian Ocean, its output has dwindled significantly, dragging down the total as seen in Chart 1. Conversely, the Arabian Sea has seen a marked increase in activity, though its frequency remains lower than that of the Bay even in recent years.
- Third, while the number of disturbances has decreased, their severity has intensified. Typically, a disturbance begins as a low-pressure area (winds <31 kmph) and can intensify into a depression (31–49 kmph) or a deep depression (50-61 kmph). Beyond this point, they are classified as cyclonic storms (62-88 kmph) or severe cyclonic storms (89-117 kmph). The most destructive stages follow: very severe (118-166 kmph), extremely severe (167-221 kmph), and super cyclonic storms (≥222 kmph).
- Chart 3 illustrates the percentage of disturbances that intensify into severe cyclonic storms or higher. In the Bay of Bengal, the share of these storms has risen notably since the 1970s. Interestingly, disturbances originating in the Arabian Sea are historically more likely to reach these severe levels than those in the Bay. Given the increasing frequency of disturbances in the Arabian Sea (as noted in Chart 2), this higher rate of intensification marks a critical shift in the region’s risk profile.
- Generally, warmer oceans provide more energy to tropical storms, making cyclones stronger and their paths harder to predict. Data show that the Arabian Sea is heating up more than average, leading to more intense, tougher-to-predict cyclones.
- Fourth, there has been a significant shift in the seasonality of these storms. In the Bay of Bengal, disturbances are increasingly originating in the final quarter of the year (October–December) rather than in the July–September window. Chart 4 illustrates this shift, plotting the percentage share of disturbances by their month of origin across different decades. Prior to the 1980s, activity was concentrated between July and September (indicated by the higher density of red squares). Since then, the focus has shifted to the final quarter of the year (red square density shifting to October to November).
Gist of daily Article /The Hindu 17oct 2025
October 17, 2025
Daily Gist of the Hindu/Indian Express : 16 Oct 2025
October 16, 2025
Daily Gist of The Hindu/Indian Express: 6 Oct 2025
October 6, 2025
Daily Gist of Article /The Hindu /Indian Express: 24 Sep 2025
September 24, 2025